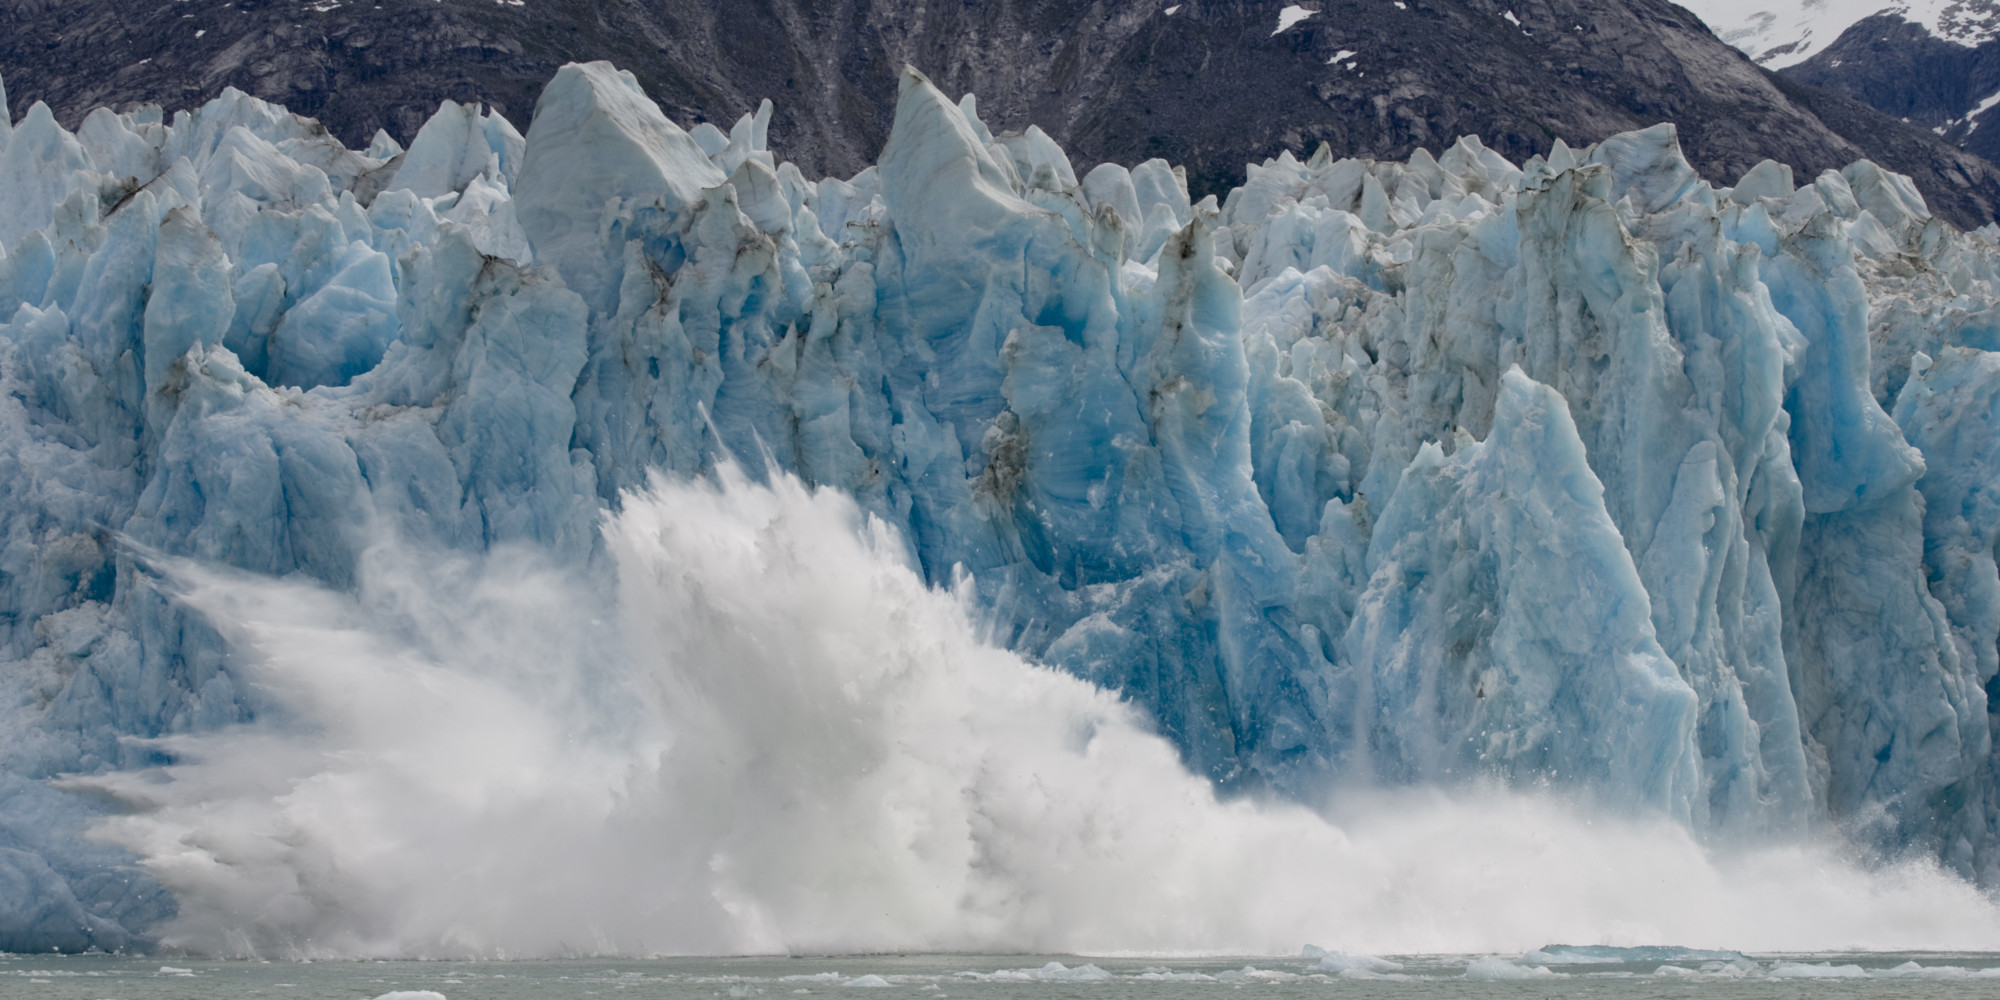
Because of climate change, sea level rise is one of the biggest consequences that we have to face, which is why NASA developed a tool that will forecast possible disaster
By mapping the glaciers and ice sheets that are contributing to local sea level rise for coastal cities, scientists can have a more accurate and complete picture of what global warming means when it comes to rising ocean levels.
“This study allows one person to understand which icy areas of the world will contribute most significantly to sea level change (rise or decrease) in their specific city,” Eric Larour, one of the study’s authors, said
The Trump administration revealed earlier this month that global average sea level has risen by about 7-8 inches since 1900. Even more, almost half of that rise comes from the last 25 years.
Forecasts show that oceans will rise on average by 1-4 feet across the globe by 2100; however, the amount will not be uniform for everyone.
Furthermore, a key element to be taken into consideration when it comes to sea level rise is the melting of land ice from ice sheets in Greenland and Antarctica, as well as glaciers worldwide. Unfortunately, tracking how that water influences individual sea levels is far from being an easy task.
Fortunately, NASA’s Jet Propulsion Laboratory have developed a tool that takes into account the rotation of the Earth and gravitational effects. This helps determine how specific melting point will impact the cities.
“Ice sheets are so heavy, that when they melt, the gravity field is modified, and the ocean is less attracted to the ice mass,” Larour said.
“This means that locally, close to the ice change itself, sea level will decrease.”


